


Data and Graphs Worksheet Grade 4-5 Answers
Data and Graphs - Practice Questions (Grade 4-5) - Answers
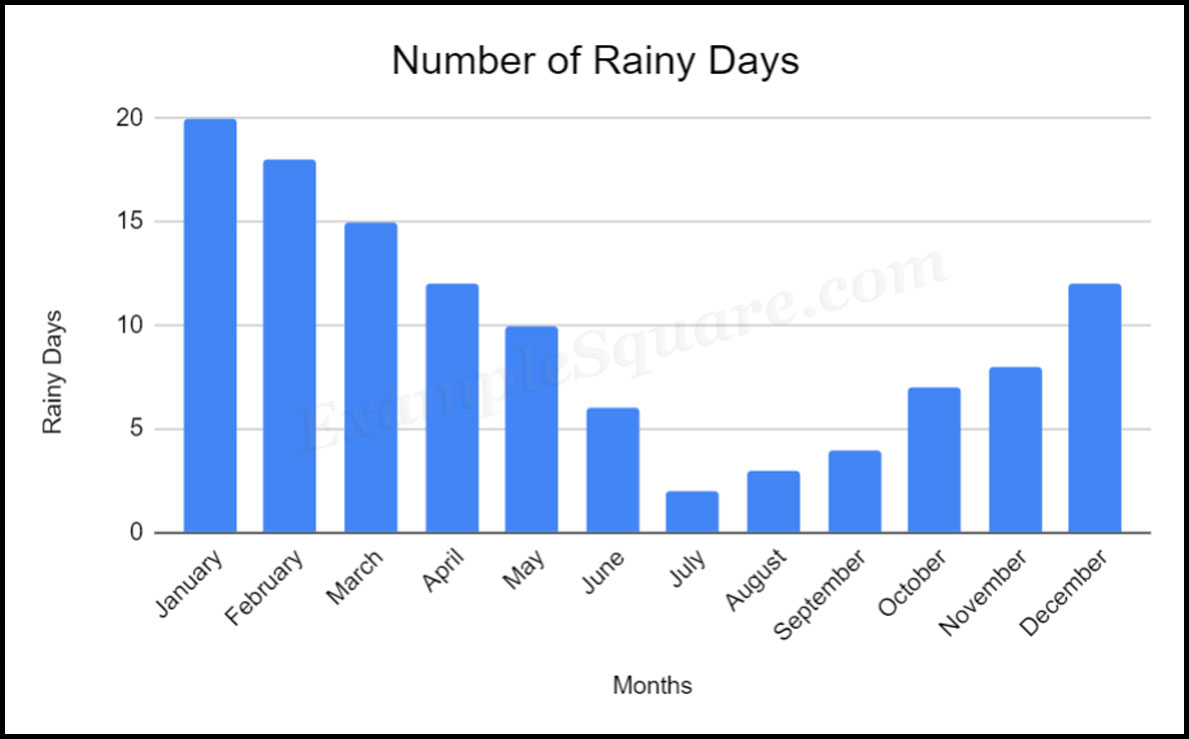
The bar graph given above shows the number of days it rained in each of the months in a year.
Below questions are based on the above graph.
Q1. Which month had most number of rainy days?
A) January
B) December
C) March
D) July
A) January
B) December
C) March
D) July
Answer 1) A
January had the most number of rainy days.
Q2. Which months had less than 5 rainy days?
A) October, November & December
B) May & June
C) March & April
D) July, August & September
A) October, November & December
B) May & June
C) March & April
D) July, August & September
Answer 2) D
The months of July, August & September had less than 5 rainy days.
Q3. How many days it rained in the month of January?
A) 5 days
B) 15 days
C) 20 days
D) 31 days
A) 5 days
B) 15 days
C) 20 days
D) 31 days
Answer 3) C
It rained 20 days in the month of January.
Q4. Which month had the least number of rainy days?
A) January
B) December
C) March
D) July
A) January
B) December
C) March
D) July
Answer 1) D
July had the least number of rainy days.
Answer 1) D
July had the least number of rainy days.
Q5. Which of the given choices correctly state, how many days did it rain in the months of January, February and March?
A) More than 60 days
B) More than 70 days
C) More that 50 days
D) More than 100 days
A) More than 60 days
B) More than 70 days
C) More that 50 days
D) More than 100 days
Answer 5) C
Rainy Days in January = 20 Days
Rainy Days in February = In between 15 and 20 days
Rainy Days in March = 15 Days
Rainy Days in January, February & March = More than 50 Days